Urinalysis Interpretation
Gregory F. Grauer, DVM, MS, DACVIM (SAIM), Kansas State University
Lisa M. Pohlman, DVM, MS, DACVP, Kansas State University
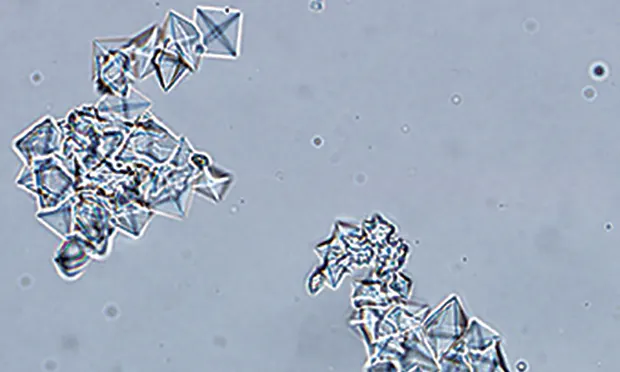
Calcium oxalate dihydrate crystals from the urine sediment of a dog. Crystals vary in size and can be individualized or in aggregates.
What is the role of a complete urinalysis in veterinary practice?
A complete urinalysis comprises physical examination of the urine sample, biochemical assessment, and microscopic assessment. Urinalysis can be inexpensive, is easily performed in-house by appropriately trained technical staff, and requires minimal specialized equipment. In the author's opinion, urinalysis is underused despite the valuable diagnostic information it provides.
Indications for Urinalysis
Any health screening program and preanesthetic patient assessment should include a complete urinalysis, a key element of a minimum database in patients with systemic or urinary tract disease. Changes in urine color, clarity, volume, odor, or frequency are indications for urinalysis, as are dysuria and stranguria. Urinalysis also provides information about kidney function via assessment of urine specific gravity (USG) and proteinuria. Cellular or granular casts or renal tubular epithelial cells in the urine sediment, and normoglycemic glucosuria and/or enzymuria, can indicate renal tubular damage or disease. Urinalysis can also help identify disease and disorders of other organ systems, and it provides information in the follow-up of patients with hematuria, urinary tract infections, proteinuria, diabetes mellitus, kidney disease, Cushing's disease, hyperthyroidism, and polydipsia and/or polyuria.
Factors Influencing Results
Method of Collection
Bacterial contamination from the lower urinary tract can occur with voided samples; iatrogenic hematuria can occur with cystocentesis.
Timing of Collection
A first morning urine sample is likely to be more concentrated than a mid-day sample, and postprandial samples may exhibit transient alkalinuria.1 In addition, previous treatment such as fluid or diuretic therapy can decrease USG and alter urinalysis findings.
Sample Handling
Urinalysis should be performed on fresh urine. If the sample cannot be evaluated within 30 minutes, it should be refrigerated in a sealed container, without exposure to light. Result accuracy decreases as time between collection and analysis increases. Refrigerated samples typically are acceptable for evaluation for 12 hours and possibly up to 24 hours, depending on the test. Urine samples must be brought to room temperature before analysis, including dipstick, or results may be inaccurate.2
Physical Examination of Urine
Physical examination of urine includes assessment of color, clarity (transparency or turbidity), and specific gravity. Normal urine color, which varies from colorless or pale yellow to dark yellow, is associated with the presence of yellow pigments called urochromes, the end products of hemoglobin breakdown. Concentrated urine typically is darker than more dilute urine; however, color should not be used to assess concentration. Abnormal urine colors include pink-red, red-brown, brown-black, yellow-orange, and yellow-green (Table 1). The most common abnormal urine color is red—usually associated with hematuria. Centrifugation of the urine sample separates the liquid from the solid components, including red blood cells, and the supernatant becomes clear. If hemoglobinuria or myoglobinuria is the cause of the red discoloration, the urine supernatant remains red after centrifugation.
Table 1: Causes of Abnormal Urine Color
Fresh, well-mixed normal urine should be clear or transparent to slightly cloudy. Cloudy urine usually is associated with presence of red blood cells, white blood cells, epithelial cells, crystals, casts, bacteria, lipid, mucus, or semen within the urine sample. Clear or slightly cloudy urine should not obviate microscopic examination of the urine sediment as abnormal findings are still possible.3
Specific gravity, the ratio of the weight of a solution to the weight of an equal volume of distilled water, is estimated using a refractometer. USG reflects the ability of the kidneys to concentrate and dilute urine compared with the specific gravity of plasma (Table 2). USG results must be interpreted in light of the patients hydration status, serum urea nitrogen and creatinine concentrations, and recent fluid therapy and medication history. Because of species differences, refractometers should be calibrated specifically for dogs and cats. For example, the USG of feline urine will likely be falsely high if measured with a refractometer calibrated for humans. Marked proteinuria and glucosuria have the potential to increase USG in dogs and cats; for every gram of protein or glucose per dL of urine, the USG may increase by about 0.005. Because IV administration of hetastarch4 and iohexol can transiently but markedly increase USG,5 urine-concentrating ability should not be assessed in dogs and cats that receive these drugs.
Table 2: Classification of USG
*Cats have greater urine-concentrating capacity than dogs; some authors state that hypersthenuria in cats is >1.040 or 1.045.6
Biochemical Assessment of Urine
Urine is evaluated semi-quantitatively (negative, trace, 1+ to 4+ scale) using commercial reagent dipsticks that undergo a color change reaction relative to the concentration of the analyte in the sample (Table 3). Well-mixed, uncentrifuged urine at room temperature is used to inoculate reagent pads; refrigeration of urine may slow reaction time. The color change typically is evaluated visually, but automated dipstick readers are available. The color change is time-sensitive, with color typically increasing beyond the ideal reaction time. Dipstick reagent methodology is not consistent across products, so results may vary. Grossly discolored urine may affect dipstick interpretation of reactions for bilirubin and ketones. Results of dipstick biochemical analyses of nitrate, leukocyte esterase, and urobilinogen are unreliable and should be ignored when assessing urine of dogs and cats.2,5,6
Table 3: Normal Urinalysis Results
Glucose
Glucose is a small molecule freely filtered through the glomerulus. Once filtered, glucose is usually completely reabsorbed from the glomerular filtrate by the proximal convoluted tubular epithelia. The most common cause of glucosuria is hyperglycemia (eg, diabetes mellitus, stress [especially in cats], glucose-containing fluids), resulting in glucose concentrations in the glomerular filtrate that overwhelm the reabsorptive capacity of the proximal tubule. The renal tubular transport maximum measurements for urine glucose in the dog and cat are approximately 180 to 220 and 260 to 280 mg/dL, respectively.7 Less commonly, glucosuria may be associated with tubular disease/damage and decreased tubular reabsorption of the glucose normally present in the glomerular filtrate (normoglycemic or tubular or renal glucosuria); examples include acute ischemic or toxic kidney injury and Fanconi syndrome in basenjis.
Bilirubin
Bilirubin is produced from hemoglobin by the reticuloendothelial system when senescent red blood cells are destroyed. Bilirubin is conjugated with glucuronide in the liver and primarily excreted in bile. Conjugated bilirubin in plasma is filtered through the glomerulus and excreted in urine. Canine kidneys can also metabolize hemoglobin and conjugate bilirubin; therefore, the renal threshold for bilirubin in dogs, especially male dogs, is low. Low-level bilirubinuria in concentrated canine urine (eg, trace or 1+ in hypersthenuric urine) is likely normal because of the low renal threshold. A 2+ to 4+ bilirubin reaction in canine urine, especially less concentrated urine, is more likely abnormal. In contrast, bilirubinuria is never normal in cats; the renal threshold for bilirubin in the cat is approximately 9 times higher than in the dog.2
The major rule-outs for bilirubinuria in dogs and cats are cholestatic disorders and hemolysis. Additional rule-outs include fever and prolonged fasting.
Ketones
Ketones (ie, β-hydroxybutyrate, acetoacetate, acetone) are produced when normal energy production shifts from carbohydrate to lipid metabolism as in diabetes mellitus, starvation, low-carbohydrate diets, glycogen storage diseases, and hypoglycemic disorders. Plasma ketones are excreted in the urine via glomerular filtration and tubular secretion; however, ketone production is normally low, and ketonuria is not seen in healthy dogs and cats. Because urine dipsticks are more sensitive to acetoacetate than to acetone (with an approximately 10-fold sensitivity difference), and they do not detect β-hydroxybutyrate, the magnitude of ketonuria may be underestimated. Ketones are volatile and will diffuse into air if the urine sample is not sealed and analyzed within 30 minutes.2,5 The most common cause of ketonuria in dogs and cats is diabetic ketoacidosis.
Heme (Occult Blood)
Heme proteins in urine (from intact red blood cells, hemoglobin, or myoglobin) react with peroxide in the dipstick reagent pad and cause a positive-reaction color change. Hematuria is the most common cause of a positive test, although in some cases of hematuria intact RBCs will not be observed in the urine sediment because of hemolysis. This is more likely to occur if the urine pH is very alkaline (>8) or the urine is very dilute (USG <1.015). Normal canine and feline urine should be negative for heme protein, but iatrogenic microscopic hematuria associated with cystocentesis may result in a positive reaction for heme.
pH
Normal urine pH in dogs and cats ranges from 5.0 to 7.5 and varies with type of diet, collection time (eg, postfasting vs post-prandial), and systemic acid-base status. Urine dipstick pH measurement approximates urine pH and is estimated to the nearest 0.5 pH unit. A more precise urine pH can be obtained using a pH meter. Potential causes of acidic and alkaline urine are listed in Table 4.
Table 4: Interpretation of Urine pH
Proteinuria
The dipstick primarily measures albumin, but sensitivity and specificity are relatively low. False-negative results (decreased sensitivity) may occur with Bence Jones proteinuria, low concentrations of albumin in the urine, and/or dilute or acidic urine. The lower limit of protein detection for the conventional dipstick test is approximately 20 to 30 mg/dL. False-positive results (decreased specificity), common in both species with the dipstick but more frequent in cats, may be associated with highly concentrated alkaline urine or the presence of albumin like proteins in the urine (eg, cauxin in cats).8
In the sulfosalicylic acid (SSA) test, equal parts urine supernatant and 3% to 5% SSA are mixed in a glass test tube and the turbidity resulting from precipitation of protein is graded on a 0 to 4+ scale. In addition to albumin, the SSA test can detect globulins and Bence Jones proteins to a greater extent than the dipstick test can. False-positive results may occur if the urine contains radiographic contrast agents, penicillin, cephalosporins, sulfisoxazole, or thymol (a urine preservative), as well as for unknown reasons. The protein content may also be overestimated with the SSA test if uncentrifuged, turbid urine is analyzed. The reported sensitivity of the SSA test is approximately 5 mg/dL. Because of the relatively poor specificity of conventional dipstick analysis, many reference laboratories will confirm a positive dipstick test result for proteinuria using the SSA test.
It is usually recommended that proteinuria detected by these semi-quantitative screening methods be interpreted in light of the USG and urine sediment. For example, a positive dipstick reading of trace or 1+ proteinuria in hypersthenuric urine has often been attributed to urine concentration rather than to abnormal proteinuria. Likewise, a positive dipstick reading for protein in the presence of hematuria or pyuria is often attributed to urinary tract hemorrhage or inflammation. In both situations, however, these interpretations may be inaccurate. Because of the limits of conventional dipstick test sensitivity, any positive result for protein, regardless of urine concentration, may be abnormal. Hematuria and pyuria have an inconsistent effect on urine albumin concentrations, and not all dogs with microscopic hematuria and pyuria have albuminuria.9 In patients with gross hematuria and/or microscopic pyuria, the source of the hemorrhage and/or inflammation should be determined and treated before further assessment of the proteinuria.
Proteinuria can be classified as physiologic or pathologic (Table 5). Physiologic or benign proteinuria can be associated with changes in exercise level, seizures, and fever and is typically low-level and transient.10 Pathologic proteinuria can be nonurinary or urinary in origin, and pathologic urinary proteinuria can be renal or nonrenal in origin. Renal proteinuria arises as a result of glomerular and/or tubular lesions and is persistent and usually associated with a normal or inactive urine sediment.
Table 5:
Localization of Proteinuria: Physiologic or Benign
Localization of Proteinuria: Pathologic
The ACVIM Consensus Statement on proteinuria recommends the following11:
Strong positive dipstick reactions (=1+; confirmed by SSA) are an indication to proceed with determination of urine protein/creatinine ratio (UPC) either immediately or at least after repeated testing in 2-4 weeks verifies persistence of the positive reactions.
Weak positive dipstick reactions (trace; confirmed by SSA) are an indication at least for repeated testing in 2-4 weeks to check for persistence of the proteinuria, with determination of UPC if the positive reactions persist.
Negative reactions (by dipstick alone, by SSA alone, or by SSA performed in an attempt to verify a positive dipstick reaction) are sufficient to exclude the existence of all forms of proteinuria except for low concentrations of albumin in the urine (microalbuminuria). Species-specific albuminuria assays (ie, microalbuminuria assays; Antech Diagnostics, Heska) can be used as screening tests for detection of early chronic kidney disease.
If screening test results show persistent proteinuria associated with normal urine sediment, urine protein excretion should be quantified. This helps evaluate the severity of renal lesions and assess treatment response or disease progression. The most common method used to quantitate proteinuria is the UPC. Although the UPCs from spot urine samples accurately reflect the quantity of protein excreted in the urine over a 24-hour period,11 it is ideal to base clinical decisions on the average of more than 1 measurement. Classification of proteinuria based on UPC findings is presented in Table 6.11
Table 6: Interpretation of UPC
Based on longitudinal test results in dogs with X-linked hereditary nephropathy, the UPC must change by at least 35% at high UPC values (near 12) and by 80% at low UPC values (near 0.5) to demonstrate a significant difference between serial values.12 A single measurement was found to reliably estimate the UPC when the values were less than 4, but 2 or more determinations were necessary to reliably estimate the UPC when values were higher than 4.12
Microscopic Assessment
The urine sample should be agitated gently before pouring off an aliquot for centrifugation because cells, casts, crystals, and bacteria will undergo sedimentation if the urine sample is left undisturbed. Low-speed centrifugation (10001500 rpm) for 3 to 5 minutes (using a standardized technique) will minimize destruction of cells and casts. It is ideal to always centrifuge the same urine volume because the concentration of elements in the sediment is volume-dependent.
Similarly, after centrifugation, the sediment should always be resuspended in the same volume of urine. If normal laboratory procedure is to centrifuge 6 mL of urine but only 3 mL is available, there would only be half of the sediment material in the 3-mL sample if it were resuspended in the normal volume of urine. Obviously, this can affect interpretation of the sediment evaluation. To avoid this error in short samples, the sediment can be resuspended in a standard percentage of the urine volume centrifuged. For example, if the sediments from 6 and 3 mL of urine are resuspended in 1.2 and 0.6 mL of urine, respectively (ie, 20% of the original volume), similar results from the sediment evaluation should be obtained. Individual laboratory reference values are typically derived by resuspending the urine sediment pellet in 20% of the original urine volume, which is usually 5 mL to 6 mL.
One to 2 drops of the resuspended, unstained sediment is placed on a slide and a coverslip is applied. The microscope condenser is lowered to reduce illumination, and at least 10 fields are examined at both 10 (low power) and 40 (high power). Several urine sediment photos are shown in Figure 1 & Figures 2-5. Sediment results are reported as the number of elements/high power field using the average of 10 fields. If the identity of a sediment element is undetermined, a stain (eg, Sedi-Stain, bd.com) can be added to the wet preparation, or the slide can be air-dried and stained with a Romanowsky stain (eg, Diff-Quik or other quick stains [eg, Wrights, modified Wrights, Giemsa, Gram]) for further evaluation.13,14

FIGURE 1
Calcium oxalate dihydrate crystals from the urine sediment of a dog. Crystals vary in size and can be individualized or in aggregates.