Echocardiography in General Practice: 4 Views to Master
Amara H. Estrada, DVM, DACVIM (Cardiology), University of Florida
Echocardiography, which is an extension of ultrasound, does not have to be limited to specialty practice. With some training and guidance, general practitioners can offer this service to clients who decline referral for a variety of reasons.
For a basic overview of ultrasonography, view our article, Ultrasonography in Practice: Practical Considerations.
A complete echocardiographic study encompasses imaging from both the right and left sides of the chest and involves more than 15 different views, using 2D echocardiography, M-mode echocardiography, pulsed-wave Doppler, continuous-wave Doppler, color-wave Doppler, tissue Doppler, and even 3D echocardiography. In the author’s experience, to become proficient and achieve an advanced level of echocardiographic skill takes an average first-year cardiology resident 6 to 12 months of performing 5 to 6 echocardiograms each day; becoming confident in accurately interpreting images may take the remainder of the residency.
Getting Started with Echocardiography
Practitioners new to echocardiography should start by using 3 or 4 basic 2D imaging views in dogs and cats of different breeds and sizes so the views can be consistently and accurately acquired. Additional views, imaging planes, and advanced echocardiographic skills can be practiced next.
A common mistake of those new to performing and interpreting echocardiography is the creation of mass lesions by angular transections (incorrect positioning of the ultrasound beam) of normal cardiac structures. The initial focus should be on chamber structure and dimension, systolic function, and presence or absence of any effusions (pleural or pericardial) or masses.
Preparing Your Patient for Successful Imaging

FIGURE 1A
Ultrasound probe positioning through table cut-out
This is how an ultrasound probe would be placed on an animal from underneath the examination table. Performing echocardiography in this position enables practitioners to use acoustic windows to optimize imaging of the heart.
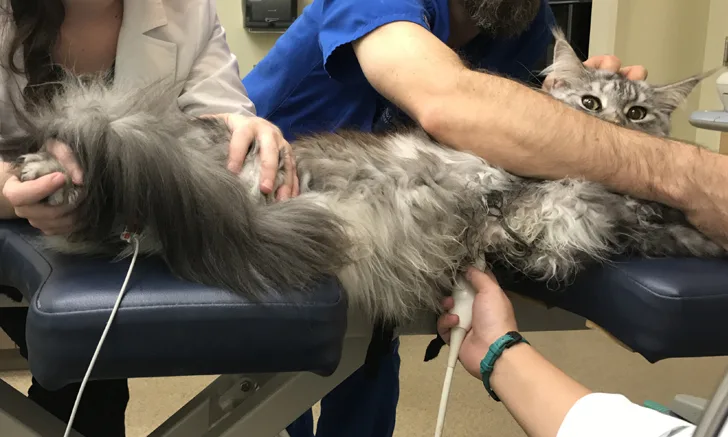
Restraint. Echocardiography usually requires only gentle restraint of the patient; sedation is not typically necessary. If sedation is used, understanding the effects of various drugs on heart rate, chamber size, and cardiac function is essential.
Positioning. Dogs and cats are usually imaged in lateral position, with forelimbs pulled far forward on a table equipped with a cutout that allows the transducer to be placed from the underside of the animal. This positioning can enhance image quality by improving the acoustic window. Dogs and cats can be imaged adequately in a standing position, but this technique can present challenges in obtaining accurate measurements. Of note, standing is the only possible position for horses and most farm animals.Because ultrasonography does not penetrate bony ribs or air inside the lungs, the heart can only be imaged where it contacts the intercostal spaces, which only occurs in small regions called acoustic windows. Specific acoustic windows on both the left and right hemithorax have been defined in animals, but optimal imaging locations can vary among individuals.
Image Site Preparation. Wetting the hair with alcohol, then liberally applying coupling gel usually produces good-quality images; however, clipping the fur may be necessary for optimal imaging, especially in long-haired or thick-coated animals.
The Echocardiogram: 4 Basic Views Obtained From the Right Parasternal Acoustic Window
The right parasternal acoustic window is located between the right 3rd and 6th intercostal spaces (usually 4th or 5th) and between the sternum and costochondral junctions. It is typically found near the strongest palpable right apical beat. Viewing 2D imaging in this acoustic window allows the most intuitive evaluation of cardiac anatomy, which also makes it a useful guide for M-mode examination. In many new ultrasound machines, this view also allows simultaneous 2D and M-mode or Doppler studies.
From the right side, 3 probe positions are used to produce 4 basic views of the heart:
Four-chamber right-sided parasternal long-axis view
Five-chamber right-sided parasternal long-axis view
Right-sided short-axis view of the left ventricle at the level of the papillary muscles
Right-sided short-axis view at the level of the left atrium and aorta
View 1: Four-chamber right-sided parasternal long-axis view

Right-sided parasternal long-axis view
View 2: Five-chamber right-sided parasternal long-axis view
Technique: The transducer is rotated and tilted slightly cranially from the four-chamber view.
Image seen: The five-chamber view shows both ventricles, atria, and atrioventricular valves, along with the left ventricular (LV) outflow tract, aortic valve, and proximal ascending aorta.1

Right-sided parasternal long-axis view
View 3: Right-sided short-axis view of the left ventricle at the level of the papillary muscles
Technique: In the four-chamber right-sided parasternal short-axis view, the plane of the ultrasound beam is oriented perpendicular to the long axis of the heart, with the transducer index mark pointing cranioventrally (roughly toward the elbow). From the four-chamber position, the transducer is rotated about 90<sup°sup>. Proper orientation is confirmed with various landmarks of cardiac structures and circular symmetry of the left-sided ventricle. Several short-axis images can be obtained at various levels by fanning the transducer from the apex to the base.
Image seen: The short axis view gives important subjective information about left ventricular (LV) function. From this position M-mode measurements can be obtained for accurate objective measurement of LV size and function. The M-mode measurements can be evaluated either via 2D imaging while scrolling through diastolic and systolic images (with an ECG for appropriate timing) or preferably, with M-mode imaging as described below in Figure 3A.

Right-sided parasternal short-axis view at the level of the papillary muscles
View 4: Right-sided short-axis view at the level of the left atrium and aorta
Technique: From the right-sided short-axis view of the left ventricle at the level of the papillary muscles, the transducer is slowly fanned up towards the base of the heart again to obtain accurate imaging of the left atrium and aorta.
Image seen: In the view shown in this figure, the ratio of the left atrium (LA) to the aorta (Ao) should be <1.5:1 (also see Figure 3B).1

Right-sided short-axis view at the level of the left atrium and aorta
Measurements & Interpretations
It is very easy to underestimate volume and function or fail to identify important lesions if the echocardiographic views do not provide optimal information, particularly when the images are then compared with published examples.
M-mode (ie, motion mode) uses a highly focused ultrasound beam that is transmitted through the heart along a single line. It is sometimes referred to as an icepick view. Although M-mode only produces a single-dimension image, the motion of cardiac structures over the cardiac cycle may be recorded with extremely high spatial and temporal resolution.
Technique
Standard M-mode images are obtained from the right parasternal window at various levels of the heart, from apex to base (similar to the right parasternal short-axis views). Optimal beam positioning is usually guided by 2D imaging. The M-mode image is depicted with depth on the Y-axis and time on the X-axis, with a simultaneous ECG allowing reference to the phase of the cardiac cycle.
Important Measurements From M-Mode
Left ventricular (LV) wall measurements:
Left ventricular (LV) internal dimension during systole and diastole (LVIDs, LVIDd)
Interventricular septum thickness in systole and diastole (IVSs, IVSd)
LV free wall thickness in systole and diastole (LVWs, LVWd)
Notations for Measurements
End-diastolic measurements are made at the onset of the QRS complex and end-systolic measurements at the smallest internal dimension.
LV dimensions and wall thicknesses should be made at the level of the chordae tendineae or the tips of the papillary muscles just below the mitral valve tips. Normal values for standard LV measurements are reported for dogs (based on weight and some breeds) and cats.
Right ventricular (RV) measurements have not been well described because of the nongeometric shape of the chamber and the difficulty in standardizing measurements. In general, the chamber dimensions and wall thicknesses of the right ventricle should be about one-third to one-half that of the left ventricle.
Right atrial size should be similar to the size of the left atrium (LA).

Left ventricular measurements using M-mode echocardiography. During both systole and diastole, this image demonstrates interventricular septum thickness (IVSs, IVSd), left ventricular (LV) internal dimension (LVIDs, LVIDd), and LV free wall thickness (LVWs, LVWd). Increased LVIDd causes left ventricular volume overload, whereas increased LVIDs results in systolic dysfunction.
Systolic Function
Systolic function can be assessed by several commonly used indexes; however, these do not directly assess contractility, as all are affected by both preload and afterload.
Fractional shortening (FS) is the most common index of left ventricular systolic function; it measures the fractional change in systolic and diastolic internal dimensions. FS, calculated from M-mode measurements, provides an estimate of the heart’s ability to contract.

Normal FS is 25% to 45% in dogs and 30% to 55% in cats.
Of importance, FS is based on single-dimension measurements and may not accurately reflect regional changes. In addition, this measurement is highly dependent on preload through the inclusion of LV internal dimensions in diastole (LVIDd). Although LVIDs depends on afterload, it has less relation to preload and by itself can be used as a measurement of myocardial function. Panting dogs often have excessive motion of the cardiac structures, which can lead to incorrect impressions of depressed systolic function. Clinicians must be careful not to overinterpret the analysis of systolic function. If there is any doubt, a board-certified cardiologist should be asked to make the final assessment of systolic function.
Assessing Left Atrial Size
To assess the size of the left atrium, the transverse diameters of the aorta and left atrium are measured in the right sided short-axis view. Of note, other views can be used to obtain measurements, but these are the author’s preferred views. Measurements are taken in early ventricular diastole using the first frame after aortic ejection, where the Ao appears as a symmetric three-leaf clover with closed aortic valves and a teardrop-shaped LA.
To measure Ao, the first caliper is placed at the midpoint of the convex curvature of the wall of the right aortic sinus. The caliper cross is positioned as close as possible to the blood-tissue interface.
The second caliper is positioned at the point where the aortic wall and the noncoronary and left coronary aortic cusps merge. This measurement point is defined by a slight increase in echogenicity where the three structures merge.
The LA is measured from this point by extending the Ao line to the blood-tissue interface of the LA wall.
If a pulmonary vein enters the LA at the desired measurement point, the caliper is placed either on an extrapolation of the atrial border or immediately medial or lateral to the vein.2

Assessment of left atrial size. This image demonstrates the measurement of the aorta (yellow arrow) and left atrium (green arrow).
General Anatomic Assessment
Direct observation of the cardiac anatomy allows noninvasive diagnosis of most congenital and acquired heart disease by echocardiography alone. Interpretations and measurements of cardiac structures can be made from 2D or M-mode images. Often the subjective interpretations of chamber size and function by an experienced operator are of similar or greater value than standardized measures.
Conclusion
Although the experience of a general practitioner does not mirror that of a board-certified cardiologist, there are many situations that echocardiography can readily fit within the scope of good general practice. Clients must be educated that the imaging objectives of a general practitioner differ from those of a specialist and that referral may be preferable, either initially or as follow-up to diagnostics performed at the general practice level.