
Serum chemistry profile is a routine diagnostic test used for health screening during annual physical examinations, etiologic investigation of clinical signs, confirmation of clinical suspicions, monitoring patient response to treatment, and guidance about physiologic location of pathology. Differential diagnoses are generated based on interpretation of laboratory results along with patient signalment, history, and clinical presentation; however, results can be unexpected, inscrutable, or inconsistent with clinical suspicion or other patient data. In these cases, spurious results secondary to sample handling, sample characteristics, and analyzer methodology limitations should be considered.
Serum chemistry profile analysis is typically performed at a reference laboratory or in the clinic by machines that require regular maintenance and calibration to provide consistent, quality results. Quality assurance plans and quality control protocols can minimize operator and machine errors. Preanalytical errors can be reduced with proper sample handling techniques; analytical errors can be minimized with regular calibration and quality control checks; and postanalytical errors can be lessened with careful transcription and thoughtful interpretation of results.
Understand the limitations of chemistry analyzers and the means of analyte measurement is key. Spurious results are relatively common and should be recognized to avoid misinterpretation of nonpathologic processes.
Presented here are, in the authors’ opinion, the 5 most common or important spurious results identified on serum chemistry profile.
1. Pseudohypoglycemia Caused by Delayed Serum Removal from a Clotted Sample
In a fresh whole blood sample, cells are alive and continue some metabolic activity (eg, anaerobic glycolysis) until they die.1 Continued consumption of glucose occurs if the serum is left in contact with the blood clot or the plasma is in contact with the cells.2 The glucose concentration can decrease as rapidly as 10% per hour when left in contact with erythrocytes.2 Leukocytosis or thrombocytosis may accelerate the consumption of glucose.3 In addition, a study revealed a marked decline in serum and plasma glucose concentration in as few as 4 hours when a whole blood sample was stored at room temperature; serum–clot contact time should not exceed 1 hour when stored at room temperature.1 Sample handling is particularly important when samples will be sent to a reference laboratory,1 as improper handling, storage, or shipping can result in a falsely low glucose concentration.3
Prevention of Pseudohypoglycemia Caused by Delayed Serum Removal from a Clotted Sample
Serum should be removed from the clot or plasma removed from packed RBCs within 30 minutes of sample collection.2 Samples to be transported to a reference laboratory for analysis should undergo serum/clot or plasma/RBC separation prior to transport and be kept on ice.
If centrifugation of clotted blood with subsequent removal of the serum is not possible, serum-separator tubes (ie, marble or tiger top tubes, gold top tubes) can be used.2 Serum-separator tubes contain a substance to promote clotting and a gel that facilitates separation of the serum from cells.
2. Severe Pseudohyperkalemia & Pseudohypocalcemia Caused by EDTA Contamination
CBC and serum chemistry profile are often requested for a complete blood panel, and cross-contamination between EDTA collection tubes and serum collection tubes or inappropriate use of EDTA-treated blood are possible.4
Cross-contamination can result in severe spurious hyperkalemia and hypocalcemia because potassium in the EDTA compound causes a falsely increased potassium concentration and anticoagulant activity of EDTA relies on the chelation of calcium to inhibit clot formation, causing a falsely decreased calcium concentration.5,6
With correct sample handling, EDTA contamination is generally considered an uncommon cause of pseudohyperkalemia and pseudohypocalcemia; however, being mindful of potential contamination is important, especially if results do not correlate with the clinical picture.7 Inappropriate treatment of hyperkalemia and hypocalcemia can be detrimental to the patient.
Prevention of Severe Pseudohyperkalemia & Pseudohypocalcemia Caused by EDTA Contamination
EDTA tubes should be filled first after sampling to minimize the risk for clot formation; however, it is critical to not contaminate the needle or remaining sample with EDTA. Proper handling technique is needed when transferring blood from the syringe to the collection tube. EDTA should not come into contact with the needle, and the sample should not be mixed until the needle is completely withdrawn from the tube.
Consideration is required for concurrent severe hyperkalemia and hypocalcemia that does not correlate with the clinical picture. For example, in the senior author’s experience, reported potassium and calcium values often associated with EDTA contamination are not compatible with life.
3. Hypercalcemia or Hypocalcemia Caused by Increased or Decreased Albumin
Hypercalcemia or hypocalcemia caused by increased or decreased albumin, respectively, may not be considered spurious but are common causes of misunderstanding and misinterpretation.
Routine serum chemistry profile analyzers measure total calcium (tCa2+) in serum and plasma. tCa2+ is the sum of 3 fractions: free/ionized calcium (fCa2+), which is the strictly regulated, biologically active form of calcium and the value of most clinical consequence; protein-bound calcium (≈80% bound to albumin and 20% bound to globulin); and calcium complexed to nonprotein anions (eg, citrates, phosphate ion, lactate; see Equation 1).8,9
(1) tCa2+ = fCa2+ + protein-bound calcium + complexed calcium
In healthy patients, ≈50% of tCa2+ is fCa2+, 40% to 45% is protein bound, and 5% to 10% is complexed.8 In cases with disturbances in serum protein concentration, detectable alterations in tCa2+ concentration are also present because protein-bound calcium concentration changes in accord with serum protein concentration (Figure 1). With hypoalbuminemia, concurrent hypocalcemia is caused by a decrease in the protein-bound fraction. With hyperproteinemia (seen in cases of hyperglobulinemia caused by myeloma), increased protein concentration may result in an increased protein-bound fraction, and an increased tCa2+ concentration is reported.8 The fCa2+ concentration is expected to be in the reference interval if increased or decreased tCa2+ is caused by alteration of the protein-bound fraction alone.
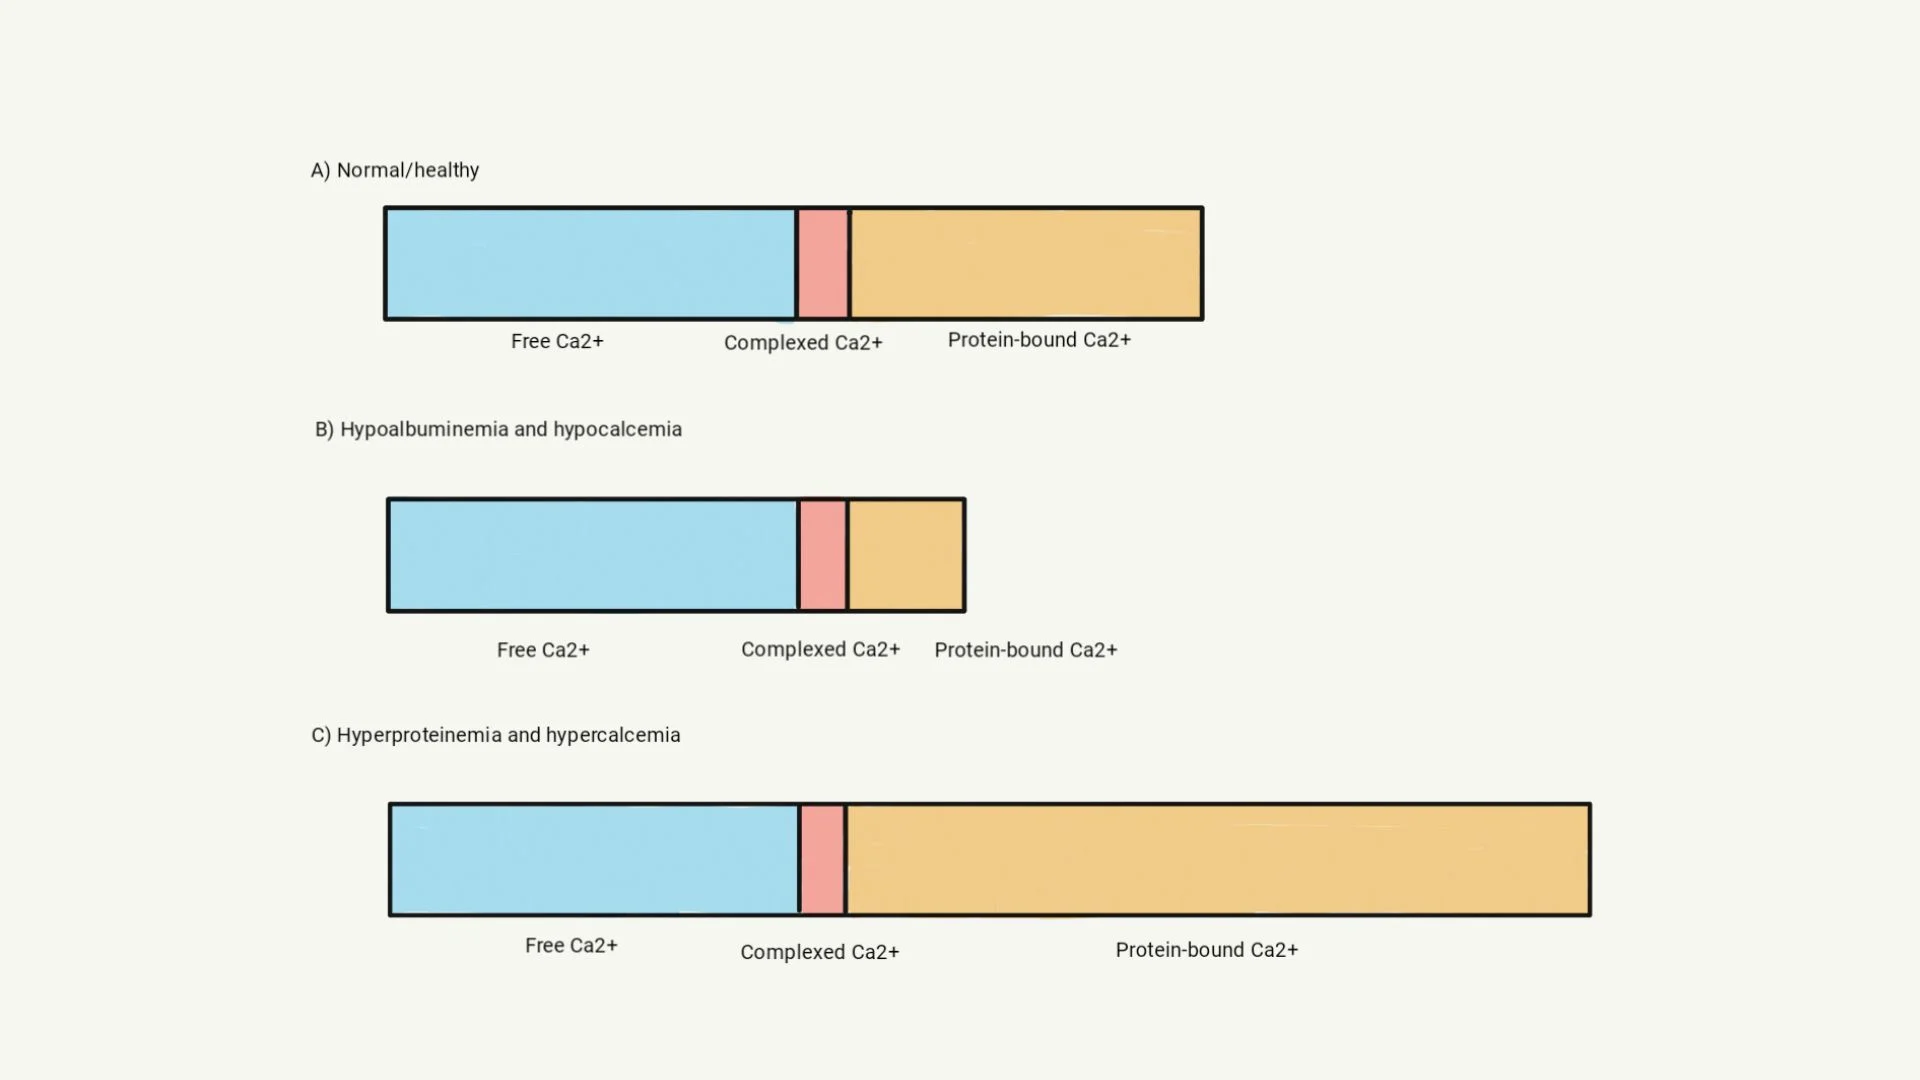
Illustration of tCa2+ measurements in patients with hypoproteinemia or hyperproteinemia. Chemistry analyzers generally measure tCa2+, which is a combination of fCa2+, complexed calcium, and protein-bound calcium (A). Loss of albumin results in a lower tCa2+ measurement because the protein-bound fraction decreases; however, fCa2+ concentration is not affected (B). Hyperproteinemia may result in increased tCa2+ concentration because the protein-bound fraction is larger; however, fCa2+ concentration remains the same (C).
Remedy for Hypercalcemia or Hypocalcemia Caused by Increased or Decreased Albumin
fCa2+ should be measured if there is concern for concurrent fCa2+ concentration disturbance because it is the biologically active form and most clinically relevant. If direct measurement of fCa2+ is unavailable, calculations to adjust the calcium for decreased albumin concentrations (adjusted calcium [aCa2+]) are available but not generally recommended because they have variable reliability (see Equation 2).9,10 In patients without hyperphosphatemia (phosphorus complexes calcium), calculating aCa2+ may help determine whether true fCa2+ hypocalcemia is present but does not provide an actual or estimated fCa2+ value.9-11
Any concurrent hypoproteinemia and hyperproteinemia (primarily albumin) should be considered.
(2) aCa2+ = tCa2+ (mg/dL) – albumin (g/dL) + 3.5 (g/dL)
4. Pseudohyponatremia Caused by Lipemia
Serum analyzers measure sodium concentrations via direct potentiometry (ie, measurement of electrical potential in an undiluted sample), indirect potentiometry (ie, measurement of electrical potential in a diluted sample), or flame photometry (ie, measurement of radiation emission after high-temperature excitation of ions).12,13 Modern chemistry analyzers typically rely on direct or indirect potentiometry (more common).14 Understanding how electrolytes are measured is important in order to understand how serum disturbances affect electrolyte calculations.
Indirect potentiometry involves dilution of the sample and interaction of the sample with an ion-selective electrode. The analyzer adds an amount of diluent that assumes the entire sample is in an aqueous phase. In lipemic samples, however, lipid artifactually reduces the aqueous layer measured by the analyzer.12,14 Electrolytes are therefore measured after being overly diluted (ie, same amount of diluent added to a relatively smaller aqueous sample), resulting in falsely low concentrations (Figure 2).12,14 Analyzers that rely on direct potentiometry (eg, blood gas analyzers) measure electrolytes in undiluted whole blood or plasma. Electrolyte measurements are thus not affected by serum disturbances (eg, lipemia).5,12,14
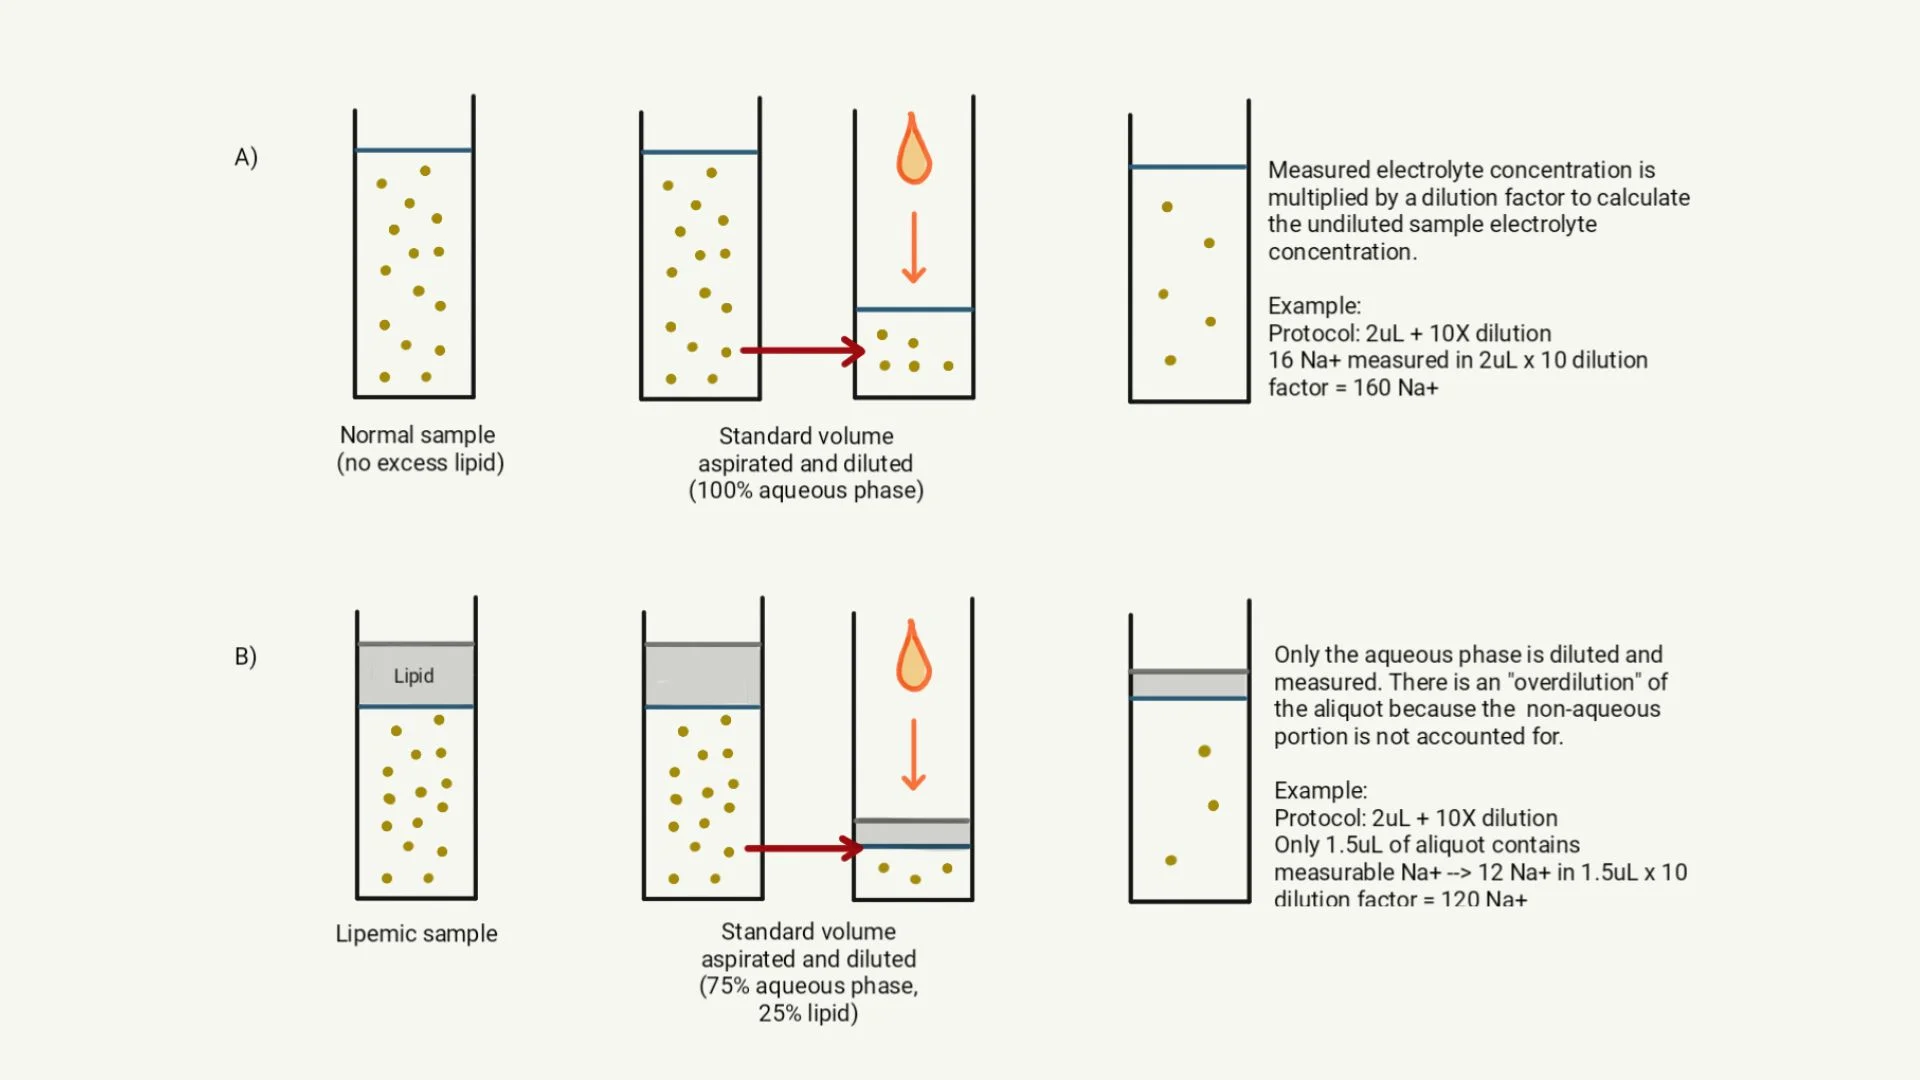
Illustration of the effect of lipemia on indirect potentiometry. (A) In a normal sample without excess lipid, serum is predominantly aqueous. The analyzer aspirates a standard volume of sample, then dilutes the aliquot based on the predetermined standard sample volume (eg, 2 mL aspirated and 10 mL diluent added for a 1:5 dilution). The analyzer determines the electrolyte concentration of the diluted aliquot and performs a calculation to reflect the undiluted concentration. (B) In a lipemic sample, the lipid portion of serum is nonaqueous. Following the same protocol as described in (A), the analyzer aspirates a standard volume of the sample for dilution. When the standard amount of diluent is added, only the aqueous portion of the aliquot is diluted; the nonaqueous portion (ie, lipid) remains the same. As a result, the aqueous portion is overdiluted, and a falsely low electrolyte concentration is reported.
Prevention of Pseudohyponatremia Caused by Lipemia
Whenever possible, patients should be fasted for ≥8 hours before blood sample collection to minimize the likelihood of physiologic (postprandial) lipemia. For familial (primary) or acquired (secondary) causes of lipemia that may not be avoided by fasting, it is important to understand the methodology used by the chemistry analyzer and be cognizant of serum chemistry profile indexes when interpreting results.
5. Pseudohyperkalemia Caused by Thrombocytosis or Hemolysis in Some Breeds
Most cells have more intracellular potassium than extracellular because of the constant activity of sodium–potassium pumps. Hyperkalemia may therefore result secondary to cell lysis or platelet-mediated intracellular potassium release during the clotting process.5,12,15-18 Serum potassium reference values account for platelet potassium release when platelet concentrations are within reference limits or are mildly increased; however, significant thrombocytosis may cause a false increase in serum potassium. A severely hemolyzed sample may also result in pseudohyperkalemia in Japanese dog breeds that have a higher erythrocyte potassium concentration than other breeds.5,12,19
Prevention of Pseudohyperkalemia Caused by Thrombocytosis or Hemolysis in Some Breeds
Plasma potassium should be measured from a heparinized blood sample and results interpreted based on plasma (not serum) potassium reference intervals. Serum should be promptly removed from blood and the sample analyzed quickly if an anticoagulant is not used.20